|
|
|
|
|
|
CLICK HERE FOR INDEX PAGE
THE TIME CHART
V. Ryan ©
2001-2010
|
|
|
|
|
PDF FILE -
CLICK HERE FOR PRINTABLE PLANNING SHEET |
|
|
|
|
|
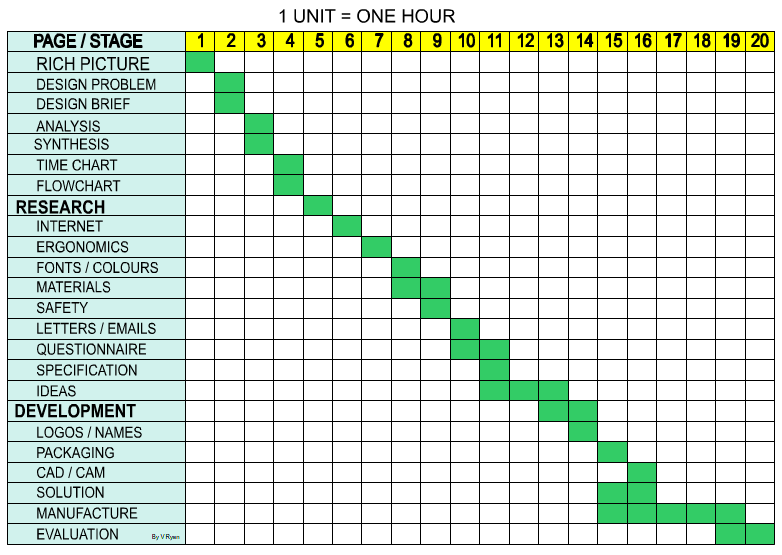
A Time Chart is a way of planning your project. Below is a
simple grid and the stages of the design process are listed down the left hand
side. As part of your project you need to show how much time you intend to spend
on each section of the project. Included is a key which shows the amount of time
that each unit represents. When you devise your time chart you may wish to
include all the sections involved in research or add sections that apply to your
individual project. |
|
|
|
|
|
|
| |
|
|
|
|
|
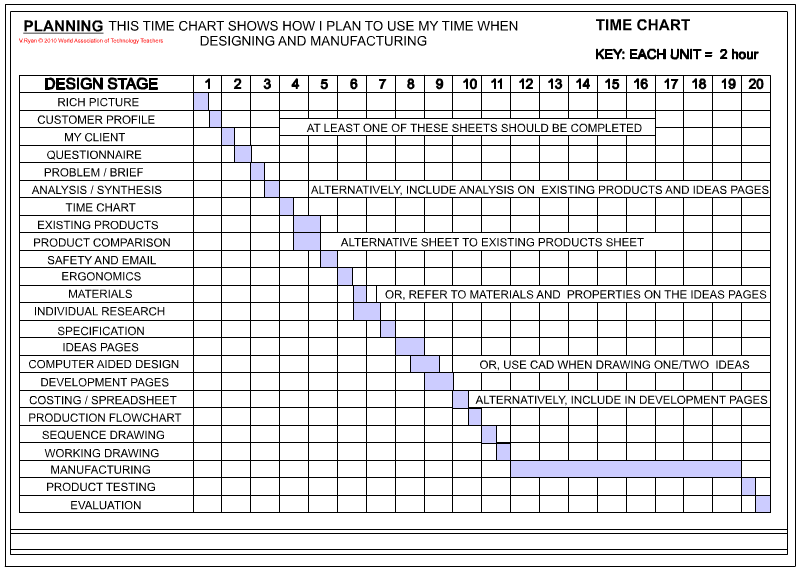
ANOTHER EXAMPLE TIME CHART |
|
|
 |
|
|
|
FURTHER INFORMATION |
|
|
|
|
|
The time chart shown above is a basic layout. When
attempting a graphics project you will need to draw it in a more imaginative
way.
1. The example shows the stages/pages of design
listed on the left hand side. You may decide to set the stages out in a
different way. However, you still need to list all pages/stages.
2. On your time chart you must clearly show how
much time has been allocated to each stage.
3. Consider including a key which states the
time each stage on the chart represents. On the example the key is at the
top (1 UNIT = ONE HOUR)
4. Consider including additional pages/stages
that only apply to your project. This may apply especially to the research
section of your project.
5. Keep the pages/stages to between 25 - 30 in
number.
6. You may want to leave blank areas for
pages/stages that you may include later. For example, You may be considering
making a small model near the end of the project. One page could be set
aside for photographs of its construction.
7. It is possible to produce two time charts.
The first will represent the designing and the second the manufacturing and
all the stages of making. If this is the case, the designing time chart can
be drawn early in the project and the manufacturing time chart near the end.
8. The time chart must be easy to follow. Keep
the layout simple but add colour and shade to enhance it.
9. If you have been told that there are a
limited number of hours for your project - the total hours represented on
your time chart should add up to this. |
|
|
| |
|
|
| |
|
SUGGESTIONS |
|
A. On paper list all
the pages / stages you intend to include in your design folder.
B. List all the stages of manufacturing,
if you know them at this stage. You may wish to have one stage representing
all the aspects of making (as seen on the example above).
C. Look at examples of time charts as
these may give ideas regarding the layout of your chart
D. Complete your homework on time. Do
not fall behind as you may find it impossible to catch up. |
|
|
|
CLICK HERE FOR FURTHER
EXAMPLES OF TIME CHARTS |
|
|
|
CLICK HERE FOR TIME CHART
EXERCISE |
|
|
|
CLICK HERE FOR TIME CHART
EXERCISE |
|
|
| |
|
|
|
Plan a time chart for a project of your choice. Remember
to allow time for each section of the project. |
|
|
|
|
|
CLICK HERE FOR DESIGN PROCESS INDEX
PAGE |
|
|
|
|