| CLICK HERE FOR INDEX PAGE |
| PICTORIAL FLOWCHARTS |
| V. Ryan © 2014 |
| PDF FILE - CLICK HERE FOR PRINTABLE WORKSHEET |
| Flowcharts are often drawn so that they are straightforward and formal looking. They are made up of one box followed by another. Although the shape of each box may have a meaning (such as input or a decision), they are not graphically exhilarating. |
| EXAMPLES OF PLAIN FLOWCHARTS |
| The Designer and Plain Flowcharts |
| CIM - Computer Integrated Manufacture - Example of a Plain Flowchart1 |
| Planning the use of a Flowchart |
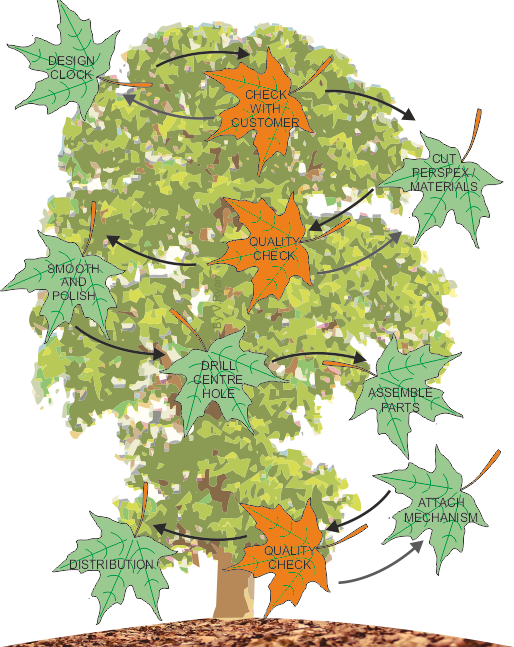
| The pictorial flowchart below, represents the manufacture of a clock. Although pictorial flowcharts are more interesting to look at, they must still present each stage clearly and include important elements, such as quality checks and quality control. |
| The pictorial flowchart is based on a tree with falling leaves. The quality checks are represented by ‘brown’ autumn leaves. |
 |
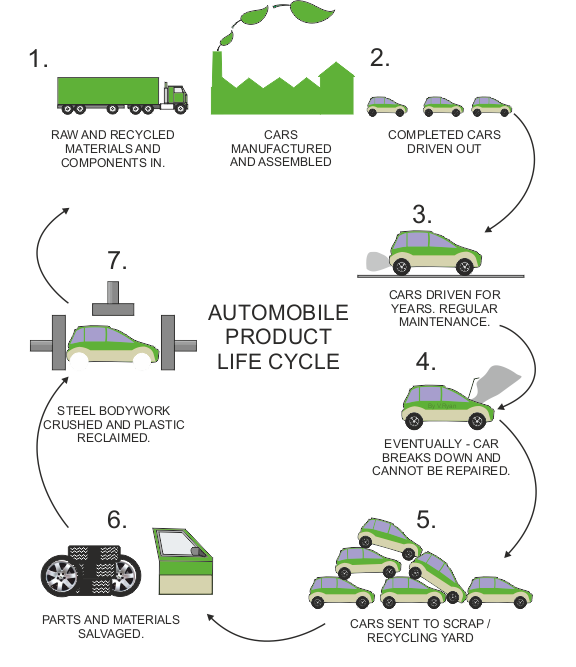
| EXAMPLE FLOWCHART - LIFE CYCLE OF A TYPICAL CAR |
 |
|
The flowchart below shows the ‘life cycle’ of a typical car. Each stage of
the car’s life cycle is represented by a simple drawing and labels /
notes. The ‘flowchart’ graphically shows how the car progresses from
manufacture in a factory, to it’s eventual ‘scrapping’ and recycling. The
recycled materials and parts go back to the factory for reprocessing or
reuse, in new cars. Green is the predominant colour, as the flowchart shows how the recycling process is environmentally friendly. |
 |
| CLICK HERE FOR GRAPHICS INDEX PAGE |