|
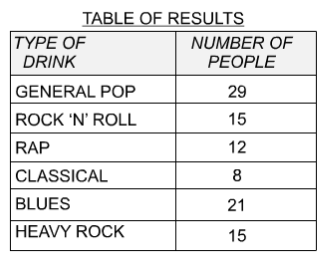
A CD ROM packaging manufacture has carried out research into the most popular types / styles of music listened to by the general public. One hundred peoples (14 years to 70 years of age) were asked a simple question - which of the following types of music is your favourite? |
||
| 1. Why is it important to this question? | ||
| 2. Why is it important to ask such a wide age group the same question? | ||
 |
||
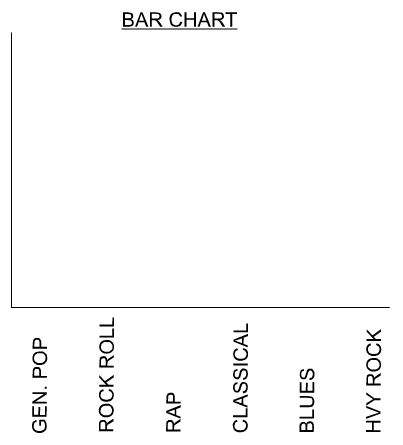
| 3a. On the scale below draw a simple bar chart to represent the figures from the table of results. Do not add colour. | ||
 |
||
|
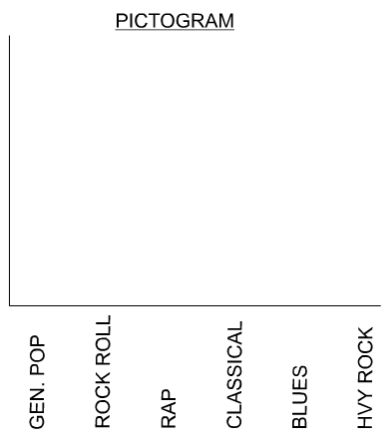
3b. On the scale to the right draw a pictogram to represent the same figures from the table of results. Use images / symbols / drawings to represent each drink. Add appropriate colour and shade. |
||
 |
||
| SAMPLE ANSWER ( Add Colour / Shade) | ||
 |
||
| CLICK HERE FOR GRAPHICS INDEX PAGE | ||