| CLICK HERE FOR INDEX PAGE | |
| MODEL ART STRAW BRIDGE PROJECT - PAGE 4 | |
| V. Ryan © 2004 - 2009 | |
|
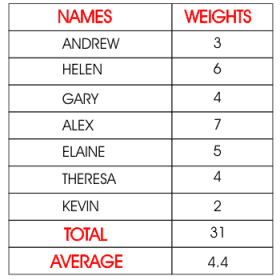
The art straw bridges constructed by a class can be tested and the data recorded (number of weights supported successfully by each bridge) . This can be presented in the form of a table and a graph or pictogram. |
|
|
|
The pupils can practice their drawing skills by constructing the table using T-Squares and Set Squares. Or use pencils and rulers. If appropriate, the pupils can work out the average number of weights supported by the bridges. |
|
|
|
|
|
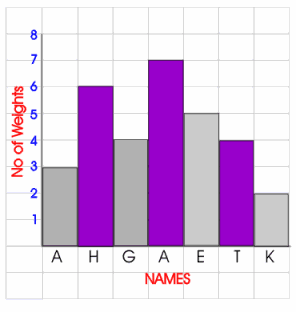
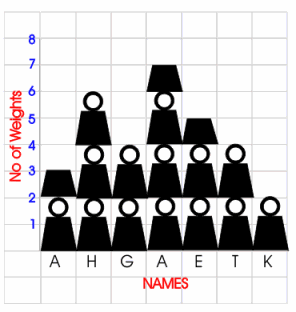
The results can be represented by a graph. A simple bar chart is shown opposite although more capable pupils may be encouraged to draw a pictogram.
|
|
|
When drawing a pictogram the bars are replaced with pictures that represent the project. The individual pictures represent the old fashioned type of metal weights, (often seen on cartoons). The weights extend to the same height as the bars on the bar chart above. |
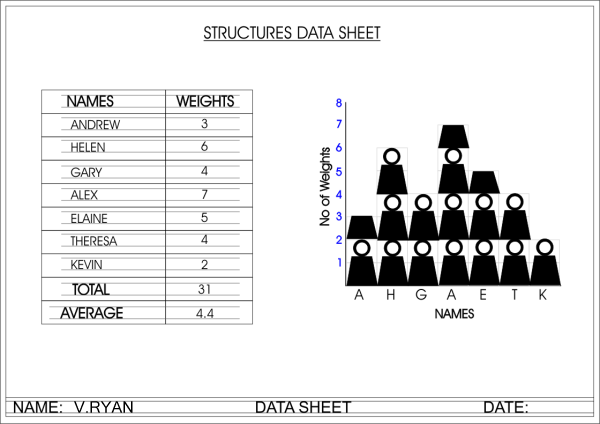
| SAMPLE DATA SHEET LAYOUT | |
 |
|
|
|
|


