| PDF FILE - CLICK HERE FOR PRINTABLE WORKSHEET |
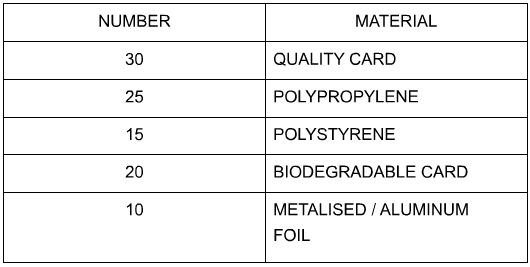
| A number of food packaging manufacturers were asked which material they used in their products. The results are seen in the table below. |
 |
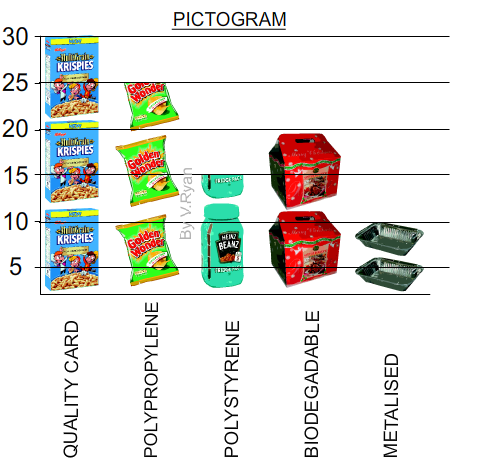 |
| 1. Click here for - How to Present Statistics as a Pictogram |
| CLICK HERE FOR GRAPHICS INDEX PAGE |