| CLICK HERE FOR INDEX PAGE | |
 |
|
|
V. Ryan © 2001-2018 |
|
|
|
|
|
PDF FILE -
CLICK HERE FOR EXAMINATION QUESTION |
|
| PDF FILE - POSTER - THE DIFFERENCE BETWEEN ANTHROPOMETRICS AND ERGONOMICS | |
| PDF FILE - POSTER - HOW TO PRESENT AN ERGONOMICS RESEARCH SHEET | |
| VIDEO - The difference between Anthropometrics and Ergonomics | |
 |
|
|
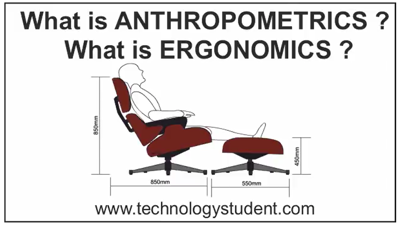
What is ANTHROPOMETRICS ? The study of the human body and its movements.
What is ERGONOMICS ? The study of people and their relationship with the environment around them.
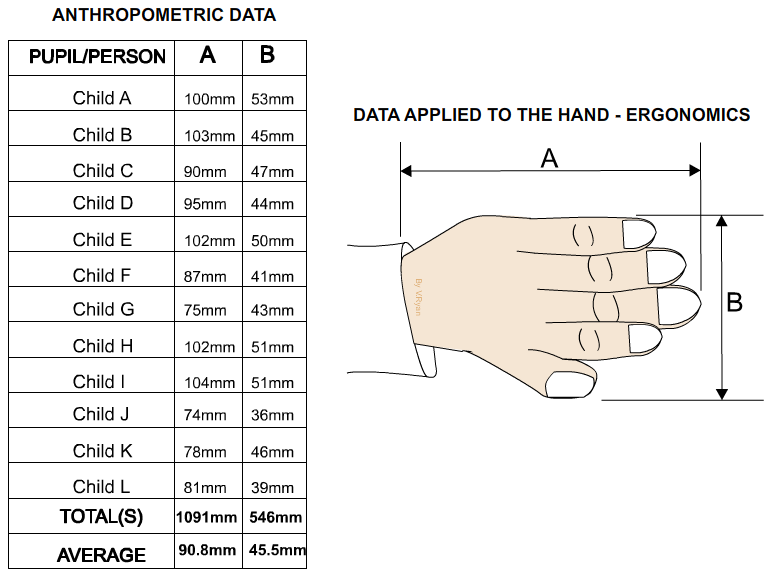
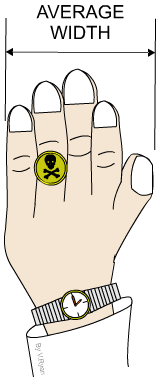
The diagram below shows, a table of anthropometric data (measurements) and how these are applied to the hand. |
|
 |
|
| Ergonomics involves the study of people and their relationship with the environment around them. It often involves research into the way people interact with products and the environment. Anthropometrical data is used to determine the size, shape and/or form of a product, making it more comfortable for humans to use and easier to use. The ergonomics of a product is usually displayed as a drawing such as the one below. | |
 |
|
| CLICK HERE FOR ERGONOMICS AND ANTHROPOMETRICS QUESTION | |
| PDF FILE - CLICK HERE FOR PRINTABLE ERGONOMICS TEMPLATE SHEET | |
|
Whatever you are designing, it must fit the person it is design for (usually called the customer / client). Adults and children come in all shapes and sizes. We all like or dislike colours, texture, sounds, tastes, flavours, forms and shapes. Consequently, when we design products, factors such as these should be kept in mind. When designing a toy there are a number of points to consider. Children learn from sound, sight, colour, movement and other aspects. These all contribute to the ergonomics or anthropometrics of a design. ERGONOMICS is mainly concerned with working out measurements, in order to improve the design of products. |
|
|
For example: When designing a chair, one of the most important factors is comfort. This is linked closely to the seating height. Usually the seating height is calculated by measuring the most comfortable height for the person who is going to use the chair. If the chair is to be used by numerous people (such as in a Doctors waiting room), it is important to measure the comfortable seating height of a range of people and then work out the average height. The average seating height is then applied to the chair. |
|
 |
|
|
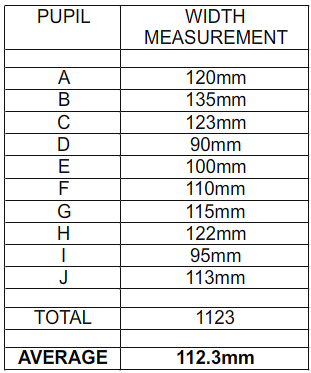
WORKING OUT AVERAGE HAND WIDTH In class you could do this by finding the average width of the right or left hand of ten pupils and dividing the total by ten (called the ‘mean average’). This can be drawn on a design sheet as a table of figures (see below). In this way, the examiner and teacher can see how you have worked out your measurements. |
|
 |
|
|
|
The table of results shows the hand width measurements of ten pupils. The measurements are added up to give a total and then divided by the number of measurements (in this case, ten). This gives the average measurement. If you were to design a door handle, the average measurement would help determine the overall size of the door handle. If you are designing objects/products that are held in the hand or operated by hand, you will need to determine the average hand width. You may need to measure the hands of teenagers, old age pensioners or business people, depending on your potential customers.
|
|
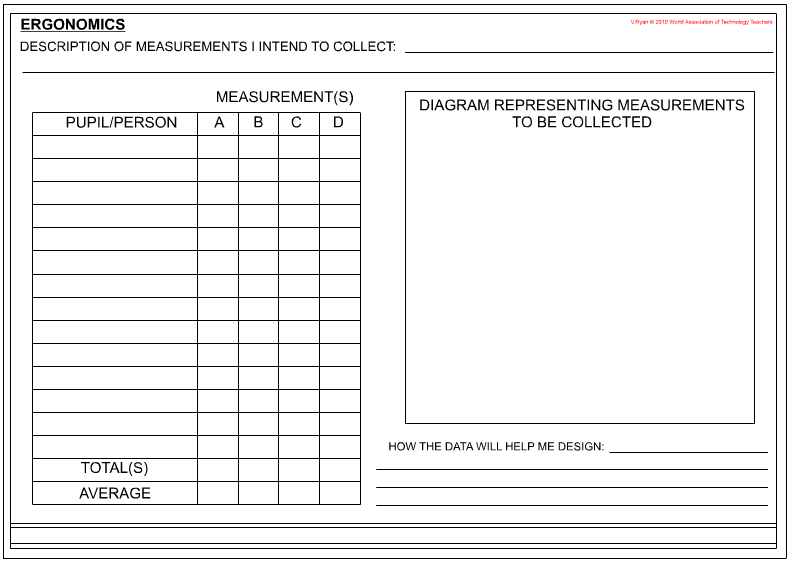
HOW TO LAYOUT AN ERGONOMICS RESEARCH SHEET |
|
|
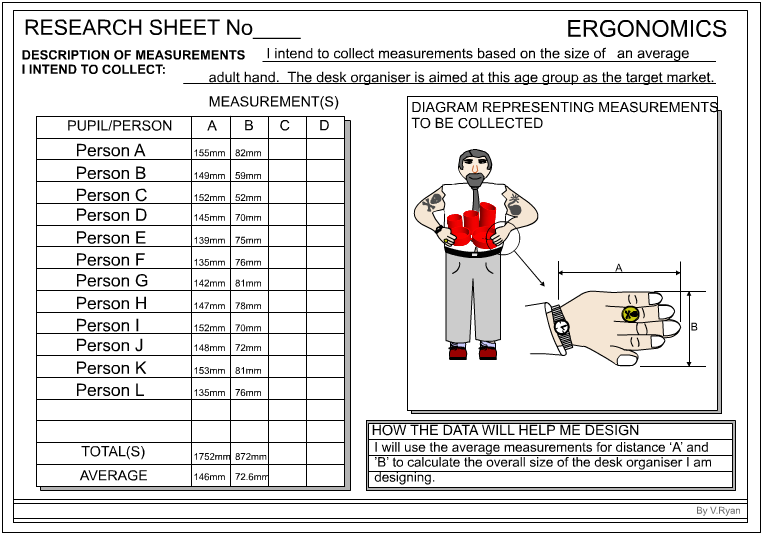
Ergonomics is an important part of research. Whatever you design it must fit the person who is to use it. For example, if you are to design a door handle you may need to collect statistics regarding the size of hands. If you are designing a chair you will need to work out the average comfortable seating height. In the example below, the statistics have been worked out for the average size of adult hand. The measurements will then help in the development of a design for a desk tidy/ organiser as the overall hand sizes will determine the overall size of the desk tidy and its compartments. |
|
| 1. Carefully
consider the measurements that need collecting for your project. When
designing a book shelf the average reaching height of an adult will need to
be determined. When designing a watch strap the average circumference of a
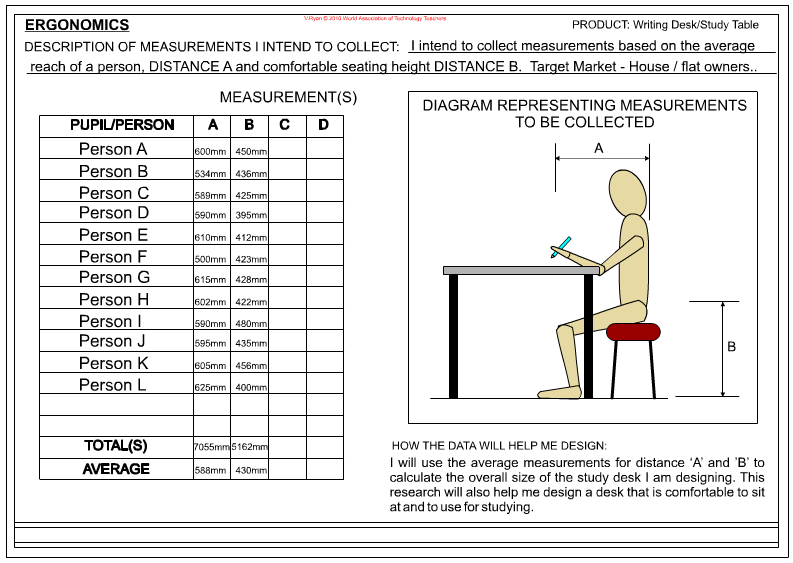
wrist will need to be calculated. 2. At the top of the page, clearly explain the measurements you are to collect. 3. Draw simple diagrams to represent the measurements you are to collect and label the dimensions - A, B, C etc... (see example) 4. Collect the measurements of at least ten people and complete the table of statistics. 5. Work out the average (mean average). This is achieved by calculating the total and dividing by the number of people taking part. Column ‘A’ of our example adds up to 1752. This total is divided by 12 as this is the number of people taking part. The answer is the average measurement. 6. Do not collect too many measurements. The example opposite has room for four columns of statistics although only two have been used. 7. Add notes and labels to the diagrams if you feel an explanation is necessary. 8. At the bottom of the ergonomics page state clearly how you intend to use the statistic you have collected. 9. The same guidance applies to collecting statistics about animals. For instance, if you are designing an automatic animal feeder it may be necessary to collect statistics regarding hamsters or gerbils. Which ever animal you choose set out the ergonomics research sheet in the same way as seen in the example opposite. |
|
|
|
|
| SUGGESTIONS: A. Decide on the statistics you need to collect. B. Keep the table simple and ensure that you work out the average measurements. C. Include diagrams to help explain the statistics you are collecting. D. Label the dimensions A, B, C etc.... E. Complete your homework on time. Do not fall behind as you may find it impossible to catch up. |
|
|
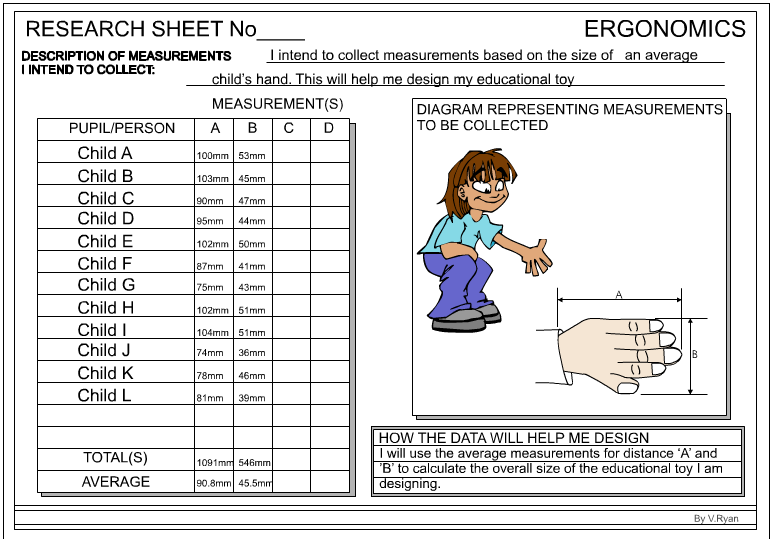
Below is another example of an ergonomics design sheet based in collecting the hand measurements of young children four to eight years of age. |
|
|
|
|
| FURTHER EXAMPLES | |
 |
|
 |
|
|
|
|
| CLICK HERE FOR ERGONOMICS / ANTHROPOMETRICS AND FEET | |
| THE EAMES CHAIR AND OTTOMAN - ERGONOMICS AND ANTHROPOMETRICS | |
| INTRODUCTION TO ERGONOMIC PRODUCTION LINES | |
|
|
|
|
|
|